Introduction
The quality of your raw data logs affects the final resulting data output from Emlid Studio: bad data in, bad data out. If you do not get the result you are looking for, it is a good idea to go back and check the raw data, or you can make it a practice to check it preemptively. This series of guides will show you how to analyze the raw data and potentially provide some solutions for fine-tuning the data before processing.
For example, after completing a survey flight with your drone, you notice a high percentage of FLOAT and SINGLE solutions where you want to see a high percentage of FIX solutions. You will want to go back and assess the raw data to understand better what is causing the problem and then decide how to best tune the processing settings to improve the result.
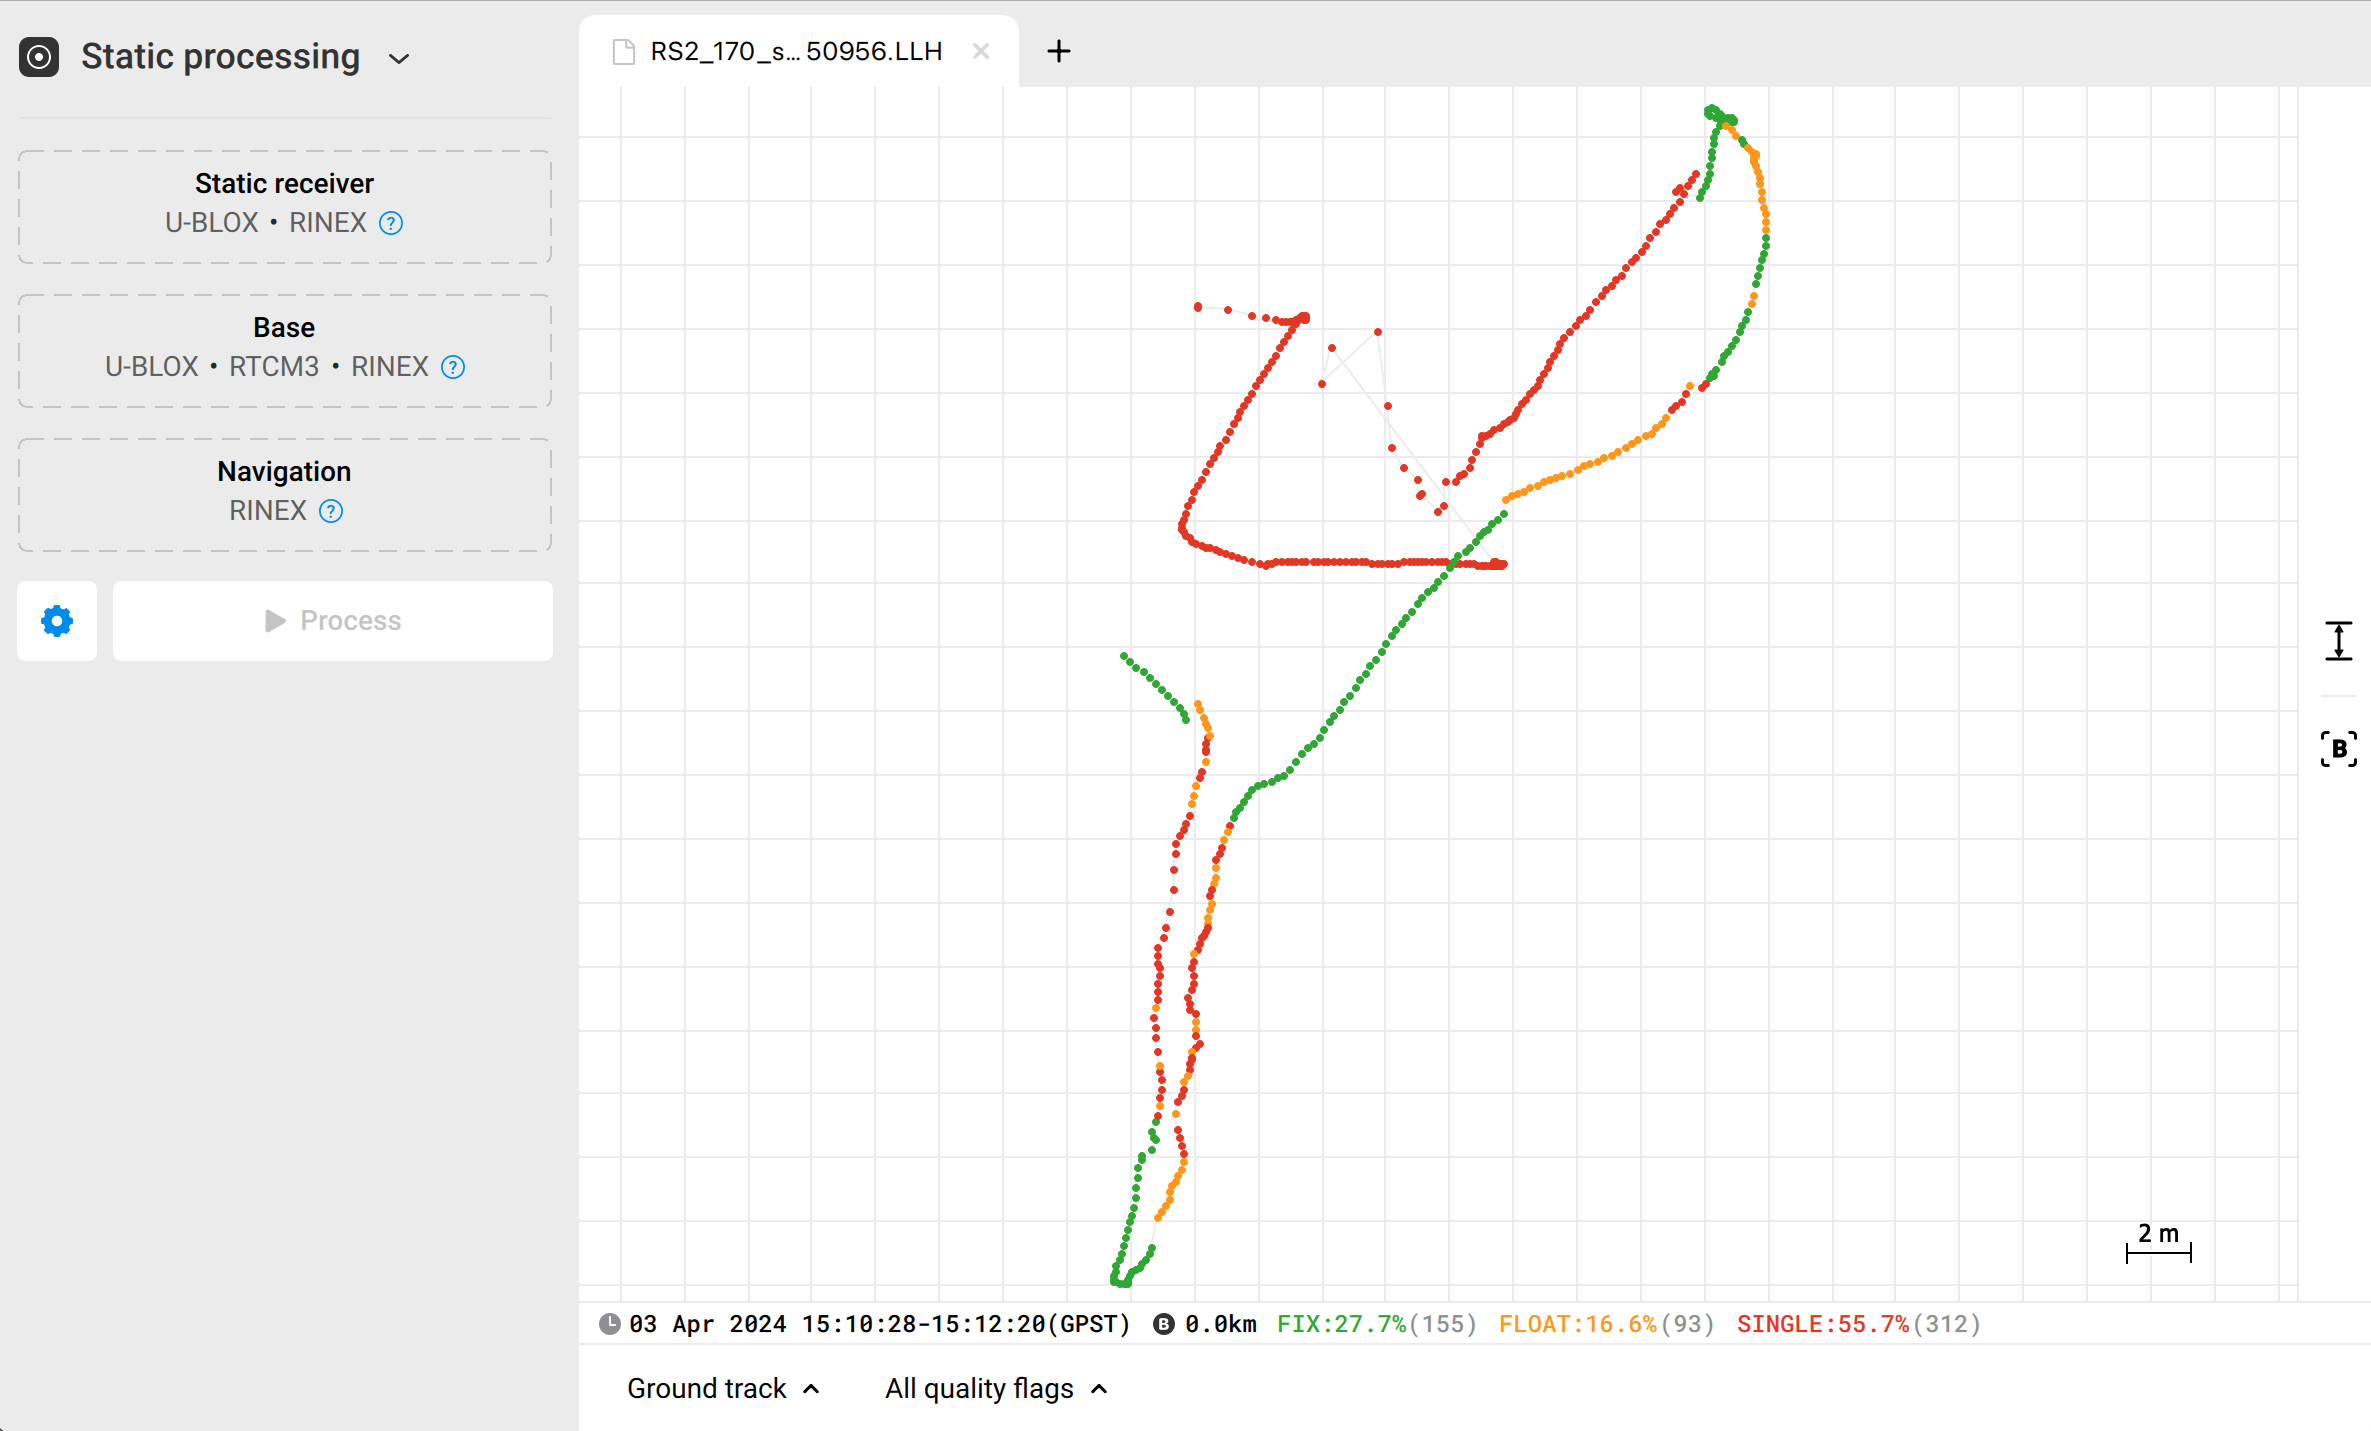
- A green-colored point means the FIX solution. Precision is at the centimeter level.
- A yellow-colored point means the FLOAT solution. Precision is at the meter level.
- A red-colored point means the SINGLE solution. Precision is usually at the several-meter level.
If the solution is insufficient for you, you can try to assess your raw data for further possible solution improvement. For this, check the following guides:
If you need help, you can contact us directly at [email protected].