Understanding PPK solution and analyzing logs from Reach
This article outlines the basic principles of analyzing raw logs before and after post-processing.
Data acquisition and export to PC
Download your base and rover raw data from ReachView. Record and download logs guide helps you with that. You'll need raw data log in UBX, RINEX or RTCM format for this tutorial.
Introduction to RTKLib tools
RTKCONV
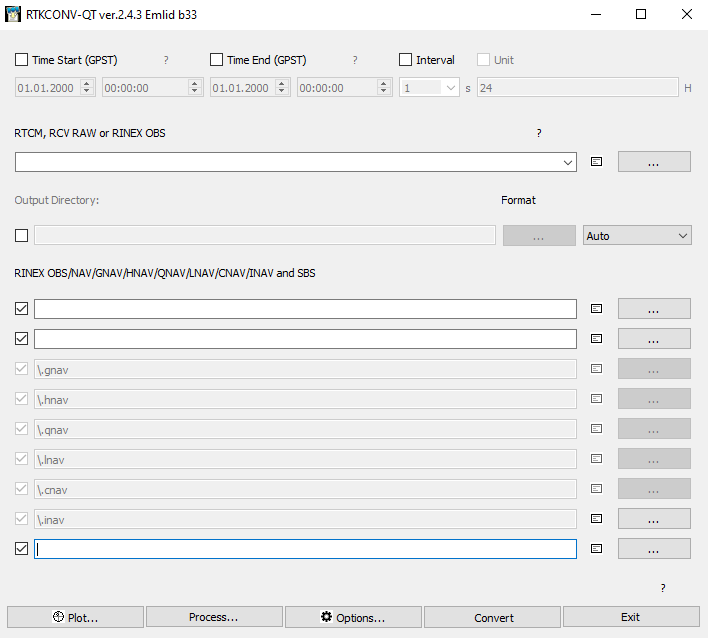
RTKCONV is a tool that converts raw data from a receiver to RINEX format. RINEX is an industry standard format for raw GNSS data, supported by most receivers and software. RINEX file contains a series of measurements from satellite constellations.
RTKCONV accepts logs in RTCM3, u-blox (UBX) formats and outputs OBS and NAV files.
The default RINEX version is the latest 3.03. You can change the RINEX version in RTKCONV Options. You may need one of the previous versions if you are going to process logs in external software.
RTKPOST
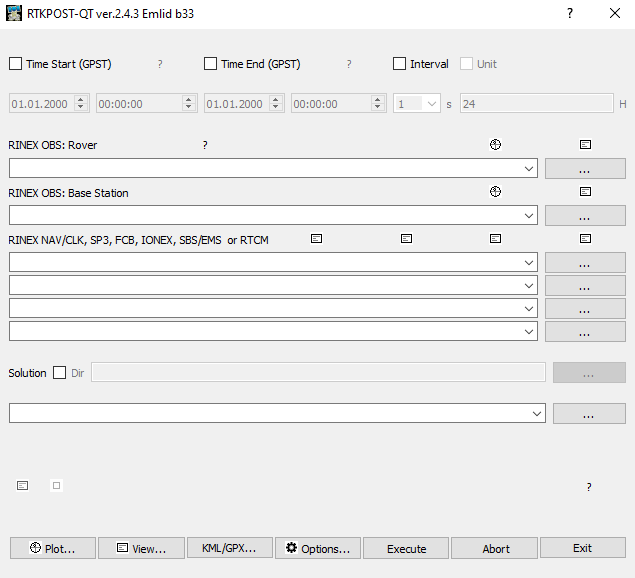
RTKPOST is a tool for post-processing raw logs. The result is stored in the position solution file—POS file.
RTKPLOT
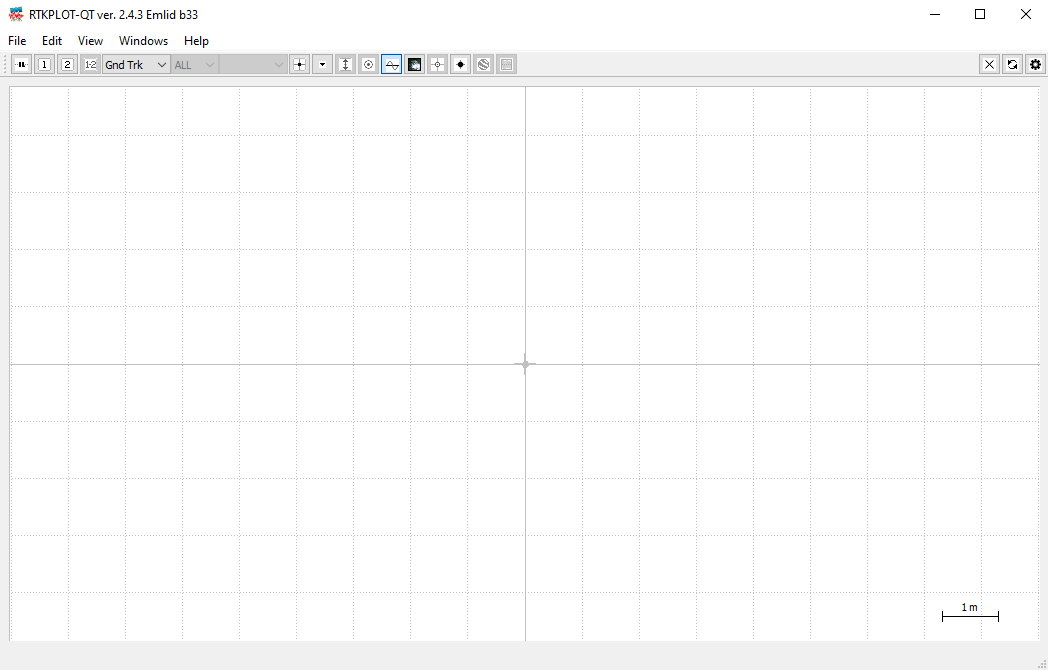
RTKPLOT allows viewing and plotting the position solutions from RTKPOST as well as observation data from RTKCONV.
Preparing the data
If you recorded raw data with Reach receivers in UBX format or got corrections from NTRIP service in RTCM3 format, you need to convert it to RINEX first. Use RTKCONV tool for it.
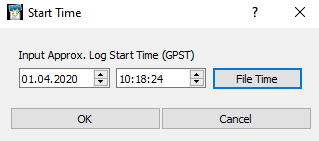
Make sure you chose the correct start time for an RTCM3 file. You can check rover log start time in RTKPLOT.
Data assessment
Don’t close RTKCONV window after converting. Hit the Plot button in the bottom left corner of the window. It will open converted OBS file in RTKPLOT.
Signal quality overview
You can see the satellite visibility graph. Change All option to L1 in the middle drop-down list to see the satellite signals’ SNR values.
SNR is a Signal to Noise ratio that indicates how good the reception is.
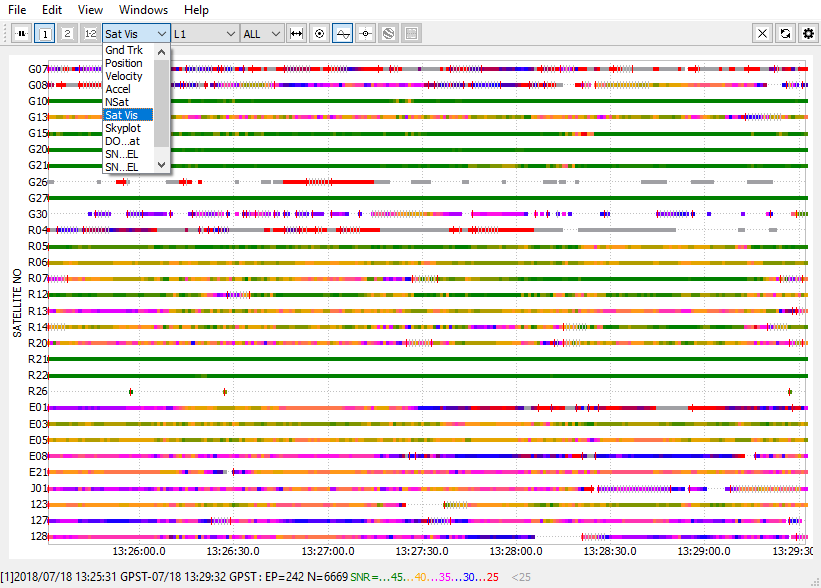
SNR legend is located on the status bar in the bottom of the window. The status bar also contains information about the log start and end date and time.
Colored lines stand for satellite traces over the time period. The color of each line changes depending on satellite SNR value.
There are numbers of each satellite on the left side of the window with their legends:
| Legend | |
|---|---|
| R | Glonass satellite |
| G | GPS satellite |
| # | SBAS satellite |
| E | Galileo satellite |
| J | QZSS satellite |
| C | Beidou satellite |
Red marks are cycle slips. Cycle slip appears at the moment when the signal was delayed or disrupted and Reach lost track of the satellite.
Some satellites can go out of sight and come back again, especially when the rover is moving. So it is a normal situation to have some cycle slips. However, if there are a lot of them, that’s not good.
You can see an example of good and bad traces on the image below.
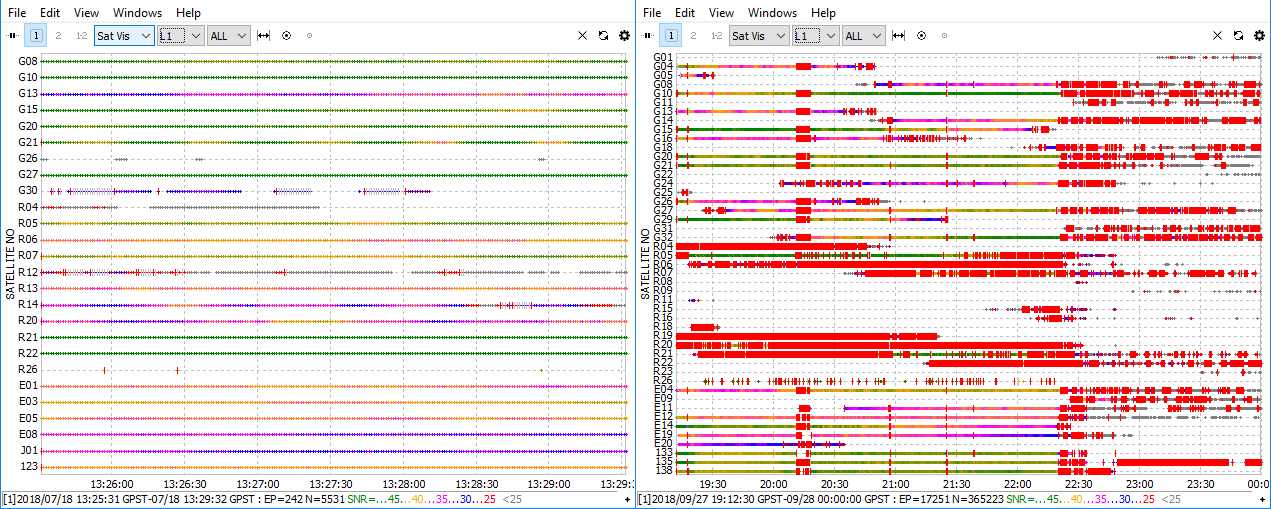
Examples of satellite traces with good reception (the left image) and with a lot of cycle slips (the right image)
Check if you have more than 4 satellites without cycle slips. This is the minimum number of satellites required for calculating centimeter accurate position. Make sure the SNR value of each satellite is more than 40.
If you see that observation data doesn’t fit the demands, proceed to Improving the quality of observation data section.
Data Post-Processing
After assessing the logs quality, post-process them and analyze the result.
As the result of post-processing, you get POS file. This file contains the position solution.
Results assessment
Ground track
Open POS file in RTKPLOT. It displays a surveying path.
- Q = 1 solution means Fix: precision is at the centimeter-level
- Q = 2 means Float: accuracy is at the submeter-level
- Q = 5 solution stands for Single: precision is usually at the several-meter level
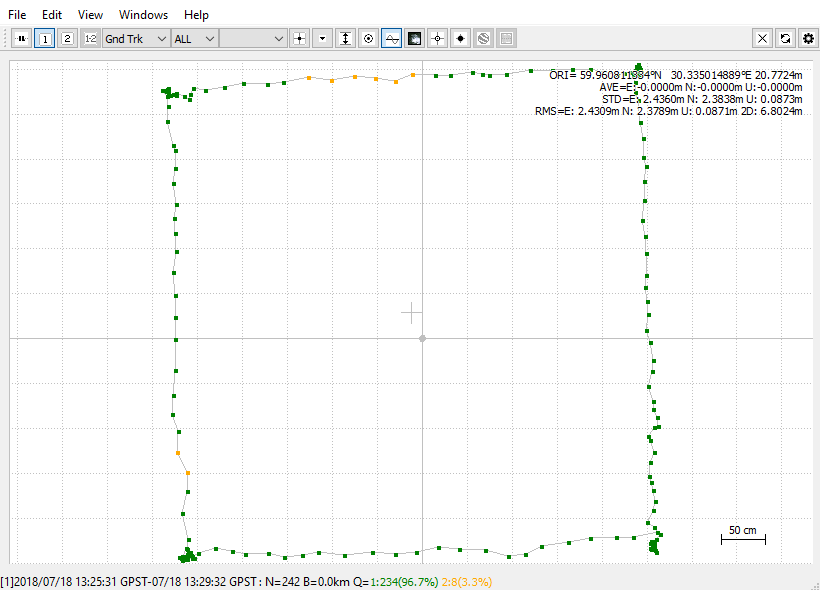
There is a status bar at the bottom of the RTKPLOT interface. The status bar shows:
- time range of surveying;
- number of solution epochs N, where epoch is a time interval between 2 nearest observations;
- distance between the base and the rover B called baseline;
- percentage of each solution Q.
If you get only a Single solution with the base file, double check if the time periods for both base and rover logs overlap. With a lot of Float coordinates proceed to Improving the Solution section of this guide.
Position
Switch Position plot type in the first drop-down list. It makes the result of post-processing more representative.
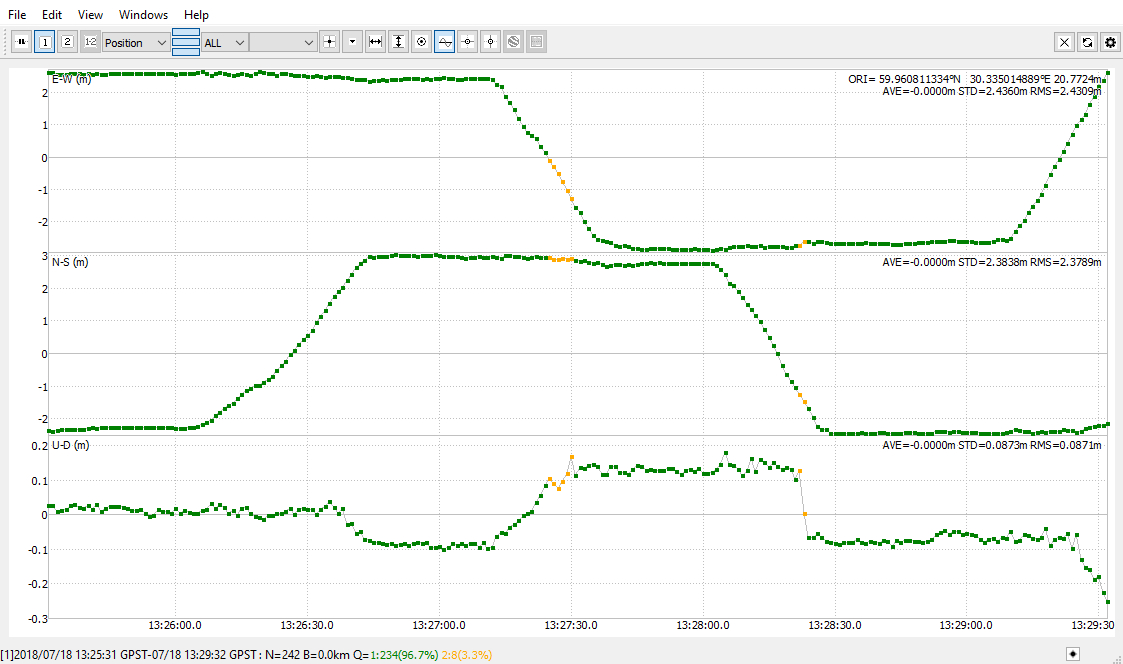
In the top right corner of the window, you can see ORI, AVE, STD and RMS values. ORI and STD values are the matter of the most interest to us.
ORI is the coordinate origin. This parameter is configured to show the average coordinate of all positions by default.
STD stands for standard deviation. In our case, STD demonstrates the largest deviation from the averaged coordinates ORI.
These values are especially important when we statically record the log over one point to get its coordinates: for example, to place a base or a ground control point.
-
East-West plot demonstrates deviations from ORI value in East-West directions in meters. We can see how the position changes during the time period
-
North-South shows deviations from ORI value in North-South directions
-
Up-Down plot demonstrates rover altitude changes
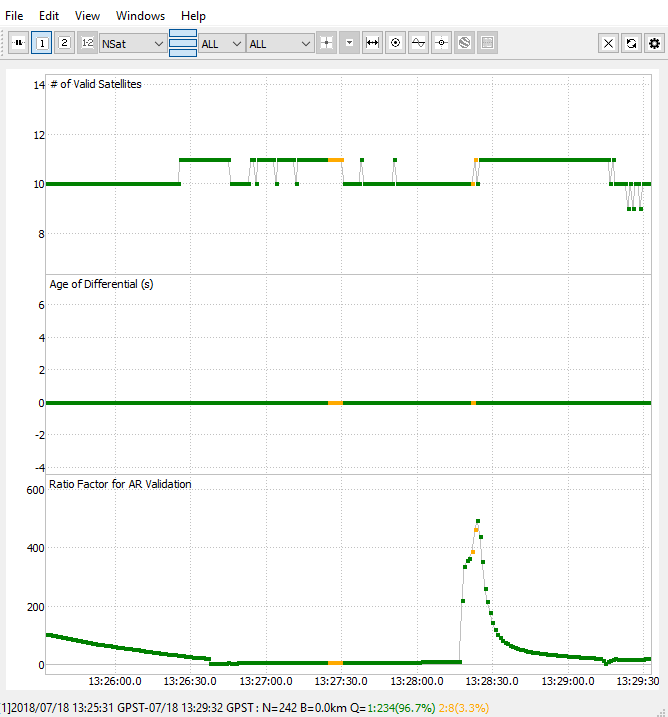
Number of Satellites
NSat field contains three graphs.
-
The top graph shows the Number of Valid Satellites
-
The middle graph shows the Age of Differential. Age of differential indicates a time gap between corrections. It is always 0 for post-processing
-
The bottom graph shows the Ratio Factor for AR Validation. AR ratio is a statistical value, showing how many times is the best solution better than the next one. When AR ratio rises above the value of 3, the solution is considered fixed
The graph displays that we had fixed solution during almost the entire surveying time. You can see how long it takes to gain first fix. You also can see periods of time when the receiver loses fix and return to float, and how changed the AR ratio during the surveying time.
Improving the results
Improving the quality of observation data
Go through this simple checklist and make sure that the following requirements are met:
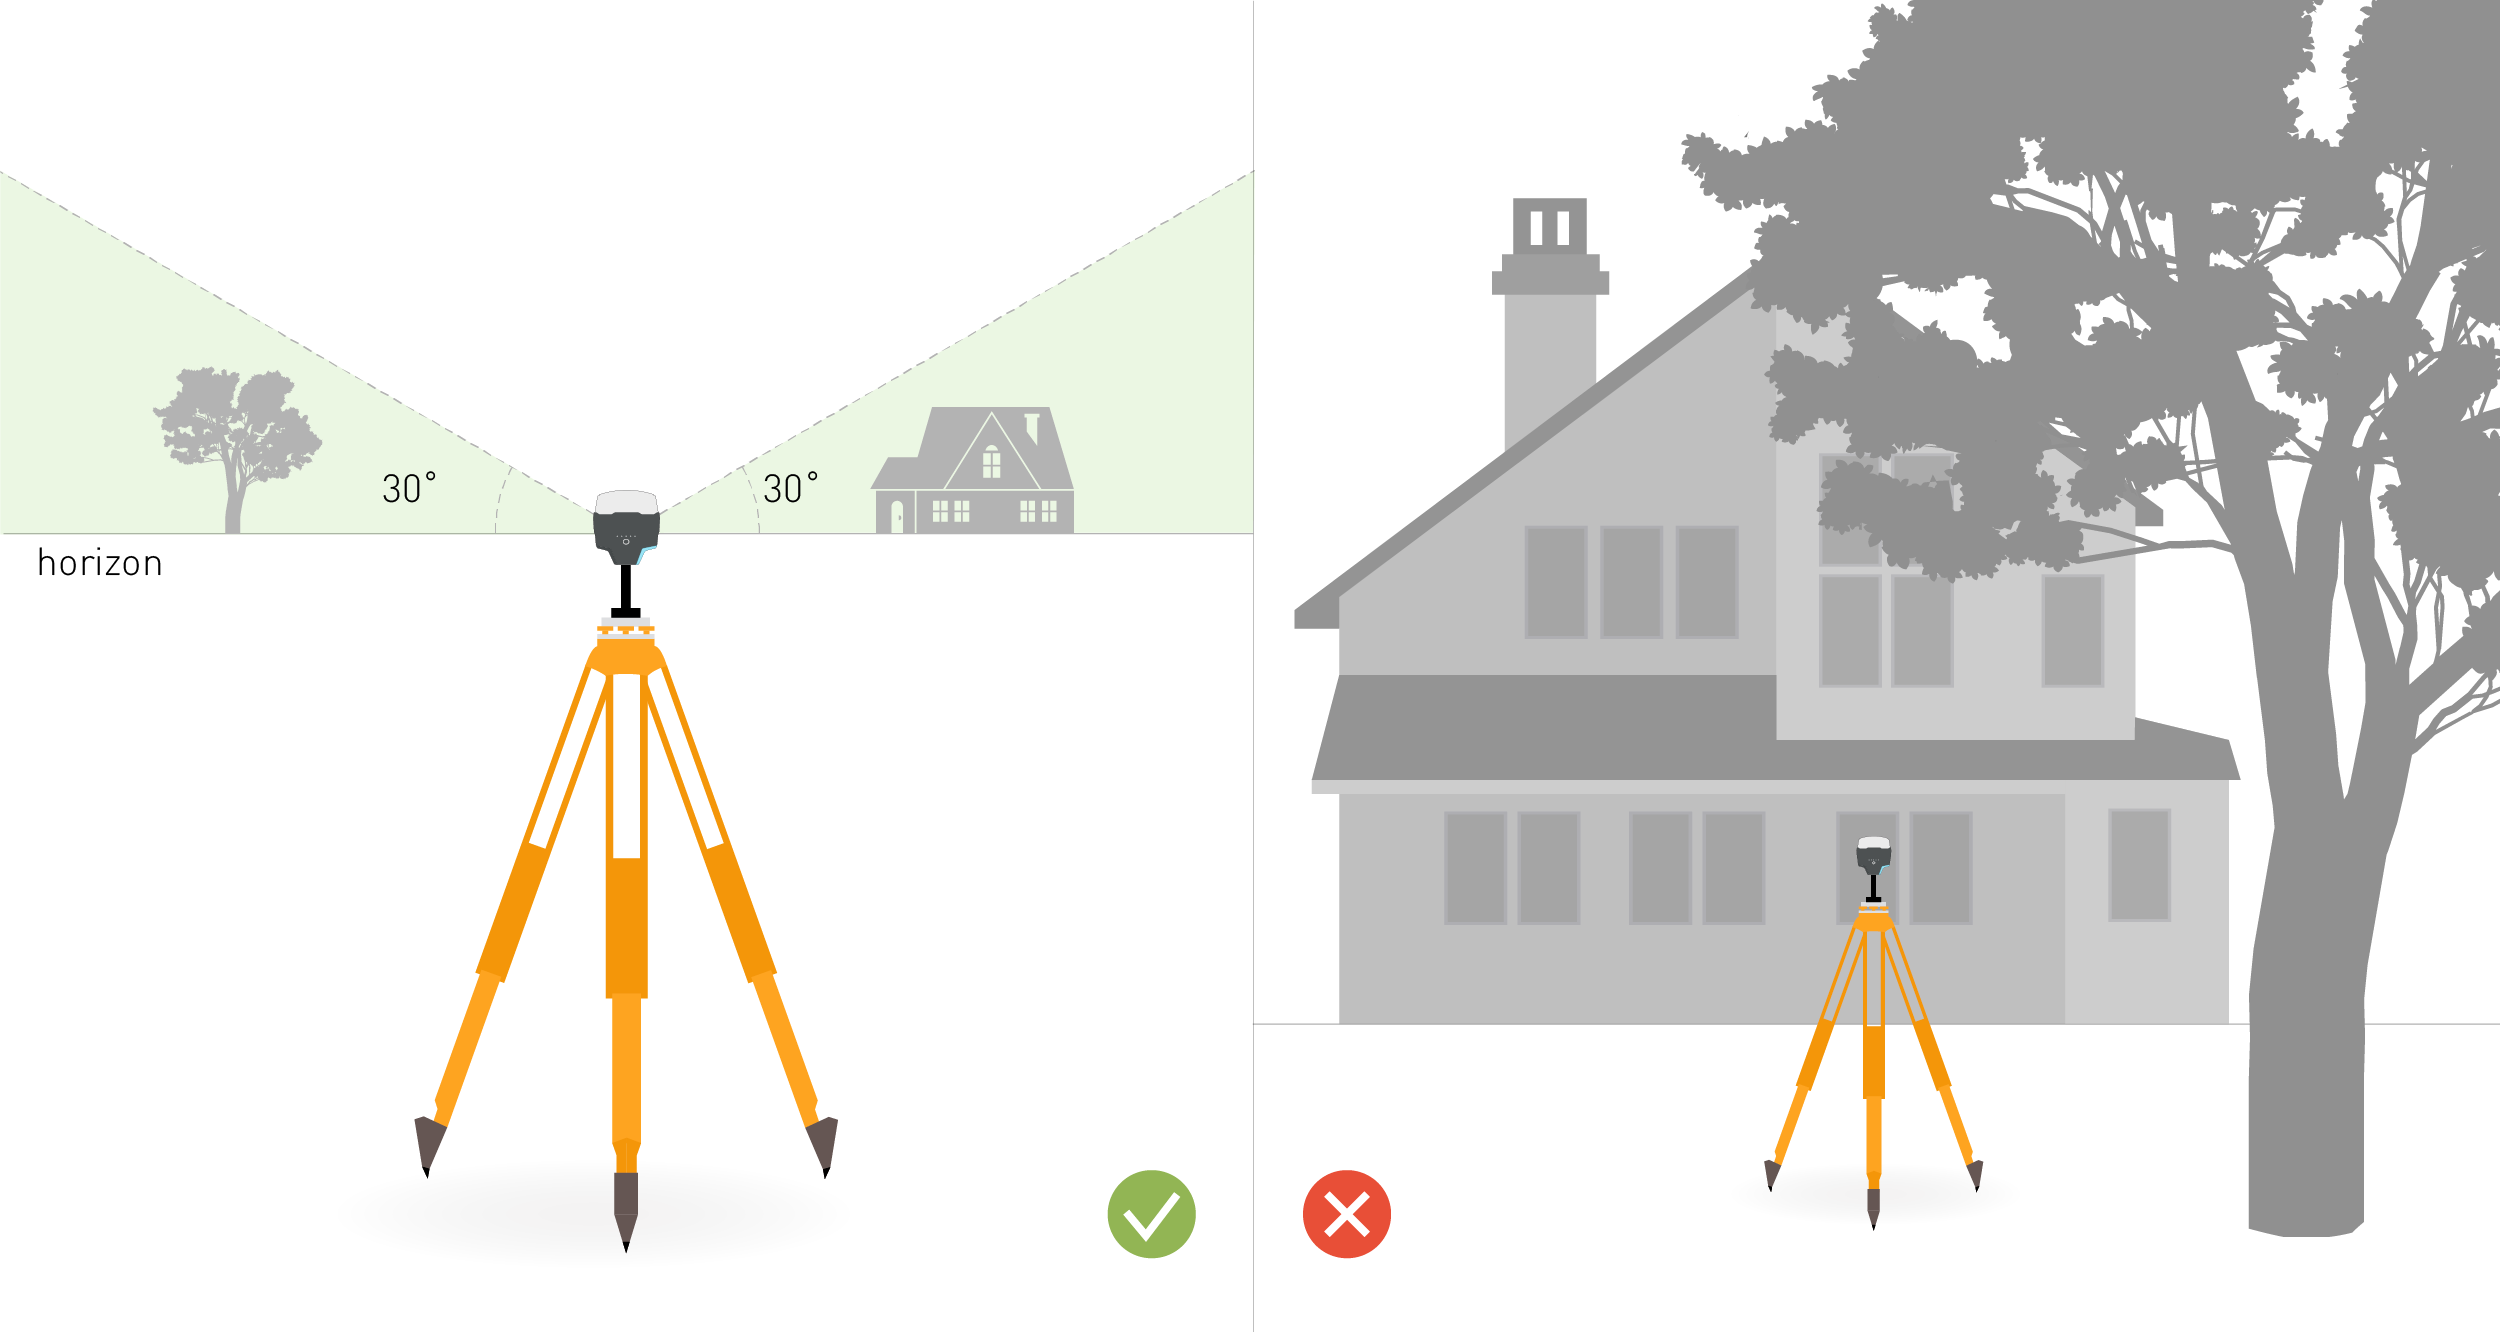
- Make sure you choose an appropriate location to place Reach base station. Take a look at 2 pictures below. The left picture demonstrates desirable conditions for the base location. The right one is an example of bad surrounding conditions such as the reduced view of the sky, possible obstructions or vegetation nearby
-
Refer to the Placing the Base article to verify that Reach Base setup is correct
-
For Reach RS / RS+ rover only: make sure the survey pole is higher than a height of a person holding it
-
For Reach M+ rover mounted on UAV only: make sure that you isolated Reach M+ unit with aluminum foil to eliminate the interference from UAV hardware components
-
For Reach M+ rover mounted on UAV only: make sure that antenna ground plane is conductive and at least 70 x 70 mm. You can read more about antenna placement here
Improving the Solution
You can try to increase the solution quality by tuning some Options in RTKPOST.
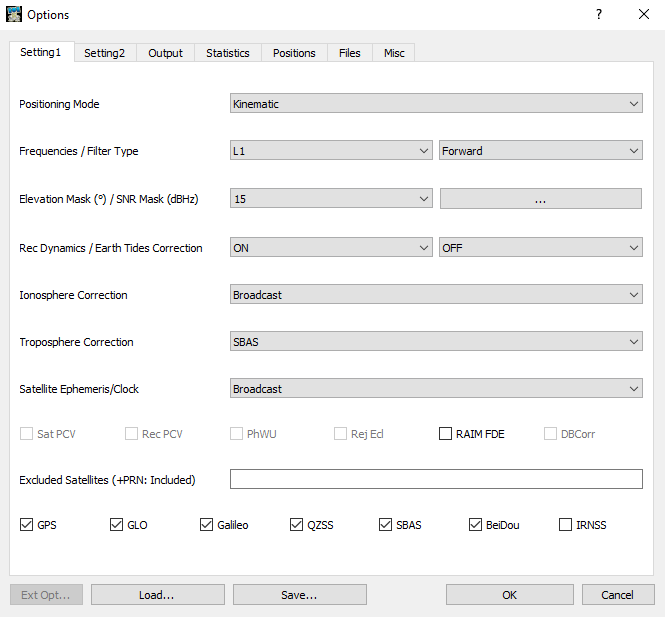
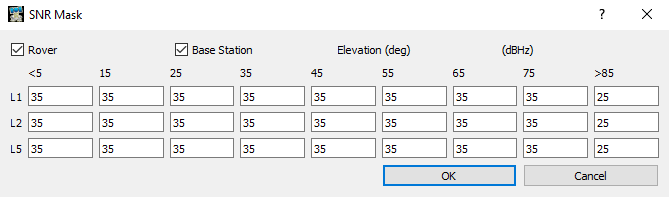
Try different values of Elevation mask and SNR mask. When the receiver calculates the solution, it includes all the satellites above these masks value.
Usually, the default value is enough to exclude satellites with low-quality signals that affect a solution and don't allow to get the fix. However, depending on the local environment, there can be more bad satellites.
Start with these settings:
- Elevation mask to 15 degrees
- SNR mask to 35
Note that with increasing masks value satellites with good signals might be reduced too. You need to gain a balance.
If you still experience difficulties with understanding logs, don’t hesitate to create a thread on Emlid community forum with all your questions!